Housing Market Valuations in U.S. Metro Areas: A Back Study for Downside Risk after Two Recessions
- Stefan Tsvetkov
- Sep 8, 2022
- 4 min read
Updated: Sep 20, 2022
September 8, 2022

Introduction:
The methodology and rationale for using valuation metrics as predictors of housing market downside risk were described in the article Real Estate Market Valuations: Predicting Downside Risk, A Back Study. Housing Market valuations serve a measure for the degree to which a market may be over-, under- or fairly valued, and its subsequent downside risk following a recession. The back study was performed for the Global Financial Crisis and covered all U.S. states and ~2700 U.S. counties.
I hereby lay out the findings for a similar study performed for close to 400 U.S. Metropolitan Statistical Areas (MSAs) following both 1990 Recession and the Global Financial Crisis.
For the Global Financial Crisis, the study resulted in 88% correlation between all MSAs percentage overvaluation at Peak and their subsequent price decline peak-to-bottom. Correlation for MSAs is higher than similar studies done at the state and county levels.
For 1990 recession, the study resulted in 60% correlation in same. At peak ahead of 1990 recession, over 70% of the MSAs studied were undervalued. Undervalued MSAs experienced very small declines as can be expected.
Price declines in overvalued MSAs were milder following the 1990 recession, in comparison to the Global Financial Crisis, as economic fundamentals recovered stronger at that time.
The majority of undervalued MSAs ahead 1990 recession paired with the strong economic recovery after it, serve to explain the lesser correlation of overvaluation and price declines, as overall declines were relatively small at the time.
Key Insights:
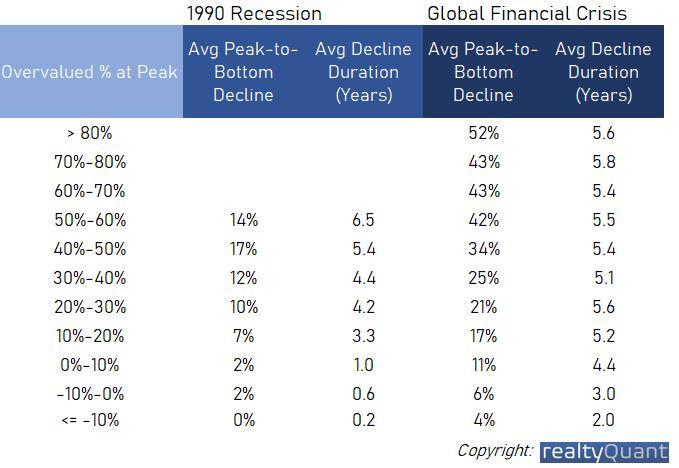
Above table shows for each of 1990 recession and the Global Financial Crisis, average peak-to-bottom declines for various ranges of percentage overvaluation, as well as the duration in years of same declines. Several key insights can be derived:
Average Peak-to-bottom declines are well ordered in relation to percentage overvaluation for both recessions. This is not surprising considering the high correlation of percentage overvaluation and Peak-to-bottom declines across the full set of MSAs. The most Overvalued range declined an average 52% peak-to-bottom following the Global Financial Crisis and 14% following 1990 recession. The most undervalued range declined an average 4% following the Global Financial Crisis and experienced no decline following 1990 recession. The rest overvaluation ranges are well ordered as well.
Average duration of declines for overvalued markets (> 10%) following both recessions was in the 4 to 6 years range. Duration of declines, was shorter for the under-valued (< -10%, -10%-0%) and fairly valued (0%-10%), relative to overvalued (> 10%) ranges, for both recessions.
Peak-to-bottom declines in the 20% to 50% overvalued ranges took 4 to 5 years on average, following 1990 recession, even those these were comparatively mild in magnitude at 10% to 17%. Average peak-to-bottom decline of 14% in the > 50% overvalued range took average 6.5 years.
Global Financial Crisis Study:
Top 10 Most Overvalued U.S. Metropolitan Areas at Peak before Global Financial Crisis:
Below are the top 10 most overvalued U.S. MSAs ahead of the Global Financial Crisis. These include MSAs in Nevada, California and Florida that were overvalued 85% to 156% at peak Q4 2005 to Q1 2007, and declined 45% to 65%, with decline duration of 4.3 to 6.5 years. At bottom following the decline Q2 2011 to Q1 2013 these MSAs were valued -34% to 11%.

Fairly Valued U.S. Metropolitan Areas at Peak before Global Financial Crisis:
Below are some fairly valued U.S. MSAs ahead of the Global Financial Crisis. These were at 0% rounded overvaluation at peak, and declined 4% to 19%, with decline duration of 0.5 to 5 years.

Top 10 Most Undervalued U.S. Metropolitan Areas at Peak before Global Financial Crisis:
Below are the top 10 most undervalued U.S. MSAs ahead of the Global Financial Crisis. These include MSAs in Oklahoma, Texas, Kentucky, Kansas, South Dakota, Louisiana, Iowa that were undervalued -24% to -12% at peak, and declined 1% to 4%, with decline duration of 0.5 to 3 years.

1990 Recession Study:
Top 10 Most Overvalued U.S. Metropolitan Areas at Peak before 1990 Recession:
Below are the top 10 most overvalued U.S. MSAs ahead of the 1990 recession. These include MSAs in California, Hawaii, Massachusetts and New York that were overvalued 36% to 54% at peak Q4 1989 to Q2 1991, and declined 7% to 21%, with decline duration of 4.5 to 8.3 years. At bottom following the decline Q3 1994 to Q3 1999 these MSAs were valued -8% to 8%.

Fairly Valued U.S. Metropolitan Areas at Peak before 1990 recession:
Below are some fairly valued U.S. MSAs ahead of the Global Financial Crisis. These were at 0% rounded overvaluation at peak, and declined 0% to 8%, with decline duration of 0 to 5 years.

Top 10 Most Undervalued U.S. Metropolitan Areas at Peak before 1990 Recession:
Below are the top 10 most undervalued U.S. MSAs ahead of 1990 recession. These include MSAs in Texas, Louisiana, Oklahoma, Wyoming that were undervalued -36% to -27%, and experienced almost no decline, with decline duration of maximum 0.5 years.

Summary:
This back study for U.S. Metropolitan Statistical Areas (MSAs) following both 1990 Recession and the Global Financial Crisis, showed high correlation between MSAs percentage overvaluation at Peak and their subsequent price decline peak-to-bottom. Several more summary observations:
Correlation in MSAs study was higher than similar studies performed at the state and county levels.
Average duration of declines for overvalued markets following both recessions was in the 4 to 6 years range. Duration of declines, was shorter for undervalued and fairly valued MSAs.
Comparatively mild Peak-to-bottom declines for overvalued MSAs following 1990 recession had significant 4 to 6 years decline duration.
Data Sources:
Federal Housing Finance Agency, Bureau of Economic Analysis
Link to Data:
About the Author:
Stefan Tsvetkov is the founder of RealtyQuant, a company that brings data-driven and quantitative techniques to the real estate industry. On a mission to add industry value through education, investment, technology, and analytics.
Financial engineer turned multifamily investor, analytics speaker, and live webinar host. He holds a Master's degree in Financial Engineering from Columbia University, and during his finance career managed ~ $90 billion derivatives portfolio jointly with colleagues.
Featured on multiple Podcast and Webinar events including Elevate, Best Ever Real Estate Show, Investing in the U.S. etc. Organizer of Finance Meets Real Estate live webinar series.
Contact for Data and Business Inquiries:
contact@realtyquant.com
+1-917-378-3154


CREDIT: Courtesy Replika torebek Gucci of VersaceThe chunky Chain Reaction runners were created as a partnership between rapper 2 Chainz and Versace footwear designerSalehe Bembury, who took cues from the luxury house's apparel patterns Replika toreb na rami? Gucci and brand DNA: Notice the subtle Greca motif on the midsole and toe, as well as on the TPU lace cage.
This study on housing market valuations and downside risk is fascinating, highlighting the importance of understanding economic trends. Similarly, when tackling complex nursing assignments, it's crucial to seek reliable help. For those needing assistance, buy nursing essay from a reputable service ensures you receive well-researched, high-quality content, much like the in-depth analysis provided in this study.